Á¦Ç° ¼³¸í
SMARTer Ultra Low RNA Kit for Illumina SequencingÀº illumina»çÀÇ Â÷¼¼´ë ½ÃÄö¼­(next-generation sequencing£»NGS)¸¦ ÀÌ¿ëÇÑ À¯ÀüÀÚ ¹ßÇö ÇØ¼®¿¡ ÀûÇÕÇϵµ·Ï µðÀÚÀÎµÈ cDNAÁ¶Á¦ KitÀÌ´Ù. ºÒ°ú100 pgÀÇtotal RNA·ÎºÎÅÍ Illumina's Genome Analyzer, HiSeq™¿Í HiScanSQ™ ½Ã½ºÅÛ¿¡ ÀÌ¿ë °¡´ÉÇÑ cDNAÀ» Á¶Á¦ÇÒ ¼ö ÀÖ´Ù. Á¶Á¦µÈcDNA´Â, illumina»çÀÇ µ¶ÀÚÀûÀÎSequencing By Synthesis (SBS)¹ý¿¡ »ç¿ëÇÏ´Â Library Á¦ÀÛ ÇÁ·ÎÅäÄÝ¿¡ °ð¹Ù·Î ÀÌ¿ëÇÒ ¼ö ÀÖ´Ù.

RNA-Seq(RNA Sequencing) ÇØ¼®Àº Áö±Ý±îÁöÀÇ À¯ÀüÀÚ ¹ßÇö ÇØ¼®°ú ºñ±³Çؼ± ÈξÀ ÀûÀº ¾çÀÇ RNA·Î ÇØ¼®À» ½Ç½ÃÇÒ ¼ö ÀÖÁö¸¸ ¸Å¿ì ¼Ò·®ÀÇ ½Ã·áÀÇ °æ¿ì¿£ ¿©ÀüÈ÷ ÇØ¼®ÀÌ ¾î·Á¿î °æ¿ì°¡ ÀÖ¾ú´Ù. ±×·¯³ª º» Á¦Ç°°ú illumina»çÀÇNGS½Ã½ºÅÛÀ» ÀÌ¿ëÇÏ¸é »ý°Ë(biopsy) Àç·á³ª ´ÜÀÏ ¼¼Æ÷ ·¹º§°ú °°ÀÌ Áö±ØÈ÷ ¹Ì·®ÀÇ »ùÇ÷κÎÅ͵µ °í°¨µµ·Î ÀçÇö¼ºÀÌ ÀÖ´Â À¯ÀüÀÚ ¹ßÇö ÇØ¼®À» ½Ç½ÃÇÒ ¼ö ÀÖ´Ù.


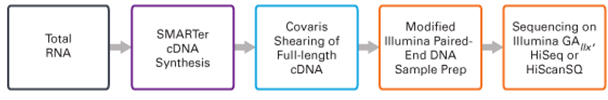
Figure 1. Overview of the sample preparation process for sequencing.

Success Story

¡°We have found the SMARTer Ultra Low RNA protocol and kit to be scientifically enabling, allowing us to ask questions about the nature of gene expression in individual cells that was not previously possible. The ability to assay the expression of individual neurons from brain slices, which we have done, allows one to correlate changes in the electrophysiology of each cell to changes in gene expression.¡±

James Knowles, M.D., Ph.D., Zilkha Neurogenetic Institute Keck School of Medicine, USC
SMART technology
SMART(Switching Mechanism At 5£§End of RNA Template) ±â¼úÀº ´ÜÀÏ ½ÇÇè ´Ü°è ¸¸À¸·Î full-lengthÀÇcDNA¸¦ ÇÕ¼ºÇÒ ¼ö ÀÖ´Â ClontechÀÇ µ¶ÀÚÀûÀÎ ±â¼úÀÌ´Ù. À¯ÀüÀÚÀÇ ÁõÆøÀüÀÇ Á¸Àçºñ¸¦ À¯ÁöÇÑ Ã¤·Î full-length cDNA¸¦ ÁõÆø½Ãų ¼ö ÀÖ´Ù. SMARTer Ultra Low RNA KitÀº SMART(er) KitÀÇ ÇÁ·ÎÅäÄÝÀ» illumina»çÀÇNGS½Ã½ºÅÛ¿¡ ÀûÇÕÇϵµ·Ï ÃÖÀûÈ­½ÃÄ×À¸¸ç À̸¦ ÅëÇØ ¹Ì·®ÀÇ RNA·ÎºÎÅ͵µ NGSÇØ¼®¿ë library Á¶Á¦¸¦ À§ÇØ ÃæºÐÇÑcDNA¸¦ Á¶Á¦ÇÒ ¼ö ÀÖ´Ù(±×¸²1).


Figure 2. Electropherogram of amplified SMARTer cDNA.
Various amounts of Universal Human Reference Total RNA (UHR) and Human Brain Reference RNA were used as input for SMART cDNA synthesis. The cDNA samples were then analyzed for purity and yield on an Agilent 2100 Bioanalyzer. Shown are Bioanalyzer trace overlays of cDNA amplified from 1 ng (red line), 0.1 ng (dark blue line), 0.05 ng (green line), and 0.01 ng (light blue line) of total RNA and a no template control (NTC; pink line). The main peak indicates the purity and yield of cDNA between 0.4 and 9 kb-with the highest point at ~2 kb. There was no amplification in the negative control (pink line). Although the amount of input RNA can vary over quite a large range (e.g., 1 ng to 0.01 ng), comparable cDNA output can be obtained by adjusting the number of PCR cycles.
Áö±ØÈ÷ ¹Ì·®ÀÇRNA·ÎºÎÅÍNGSÇØ¼®
SMARTer Ultra Low RNA Kit(Àº)´Â »ùÇÃRNA¾ç¿¡ ´ëÇØ¼­ ³ÐÀº ¹üÀ§¿¡ ´ëÇØ ³ôÀº ÀçÇö¼ºÀ» ³ªÅ¸³½´Ù. illumina»çÀÇNGS±â±â¸¦ ÀÌ¿ëÇßÀ» °æ¿ì, ´ÜÀÏ ¼¼Æ÷ ·¹º§°ú °°ÀÌ ±ØÈ÷ ¹Ì·®ÀÇRNA·ÎºÎÅ͵µ ½Å·Ú¼ºÀÌ ³ôÀº À¯ÀüÀÚ ¹ßÇö ÇØ¼®À» ½Ç½ÃÇÒ ¼ö ÀÖ´Ù. 10 ng, 1 ng, 0.1 ng, 0.05 ng, 0.01 ngÀÇ mouse brain total RNA ¸¦ ÀÌ¿ëÇØ library¸¦ Á¦ÀÛÇÑ ÈÄ illumina»çÀÇGAIIx½Ã½ºÅÛÀ¸·Î sequence¸¦ ÇØ¼®ÇÏ¿© mouse genome»ó¿¡ mappingÀ» ½Ç½ÃÇß´Ù(°¢ »ùÇÿ¡ ´ëÇØ °¢°¢1°³ÀÇ laneÀ» »ç¿ë.~20 million reads/lane). ±× °á°ú, ºÒ°ú10 pgÀÇRNA¸¦ ÀÌ¿ëÇß´ø ½ÇÇè¿¡¼­µµ sequence µ¥ÀÌÅÍÀÇ90%ÀÌ»óÀ» genome»ó¿¡ mapping ÇÒ ¼ö ÀÖ¾úÀ¸¸ç transcript coverageÀ²Àº º¸´Ù ¸¹ÀºRNA¾çÀ» ÀÌ¿ëÇß´ø °æ¿ì¿Í µ¿µîÇß´Ù ((Ç¥)1, ±×¸²3).

Table I. Primary sequencing metrics from very small amounts of total RNA
Sequencing Metric 10 ng 1ng 0.1ng 0.05ng 0.01ng
% Mapping to Genome 97% 96% 95% 94% 92%
% Ribosomal RNA 4.3% 5.0% 3.8% 3.9% 3.9%
Number of Genes Detected 16,610 15,425 12,847 11,516 8,618


Figure 3. Comparison of transcript coverage with different amounts of input RNA
Shown are overlaid plots comparing the average read coverage from libraries made with 1 ng to 0.01 ng of mouse brain total RNA. The x-axis represents gene length normalized to 100%, where 0 is the 5¡¯-end of each transcript and 100 is the 3¡¯-end. The y-axis indicates the average coverage for a set of ~600 genes that are moderately to highly expressed in brain tissue. The results are very consistent through the range of input RNA used, with full-length coverage of the transcripts reflecting no systematic 5¡¯- or 3¡¯-bias.


Figure 4. Gene expression data obtained from very low amounts of RNA correlate well with data obtained by qPCR. Scatter plots were used to compare differential expression data obtained by sequencing with the SMARTer Ultra Low RNA Kit (1 ng total RNA) and quantitative PCR (qPCR) data available for Universal Human Reference Total RNA (UHR) and Human Brain Reference RNA through the MicroArray Quality Control (MAQC) project. The differential expression of ~700 genes showed correlation values of 0.94, demonstrating that the sequencing results are consistent with orthogonal gene expression technologies.
³»¿ë
º¸Á¸
¿ëµµ
illumina»çÀÇ NGS ½Ã½ºÅÛÀ» À§ÇÑ RNA-Seq¿¡ ÃÖÀûÈ­µÈ cDNA ÇÕ¼º (illumina ¸Å´º¾ó¿¡ Æ÷ÇÔµÈ Kit)