Combining droplet and full-length sequencing technologies for a complete picture
21세기 초, 차세대 염기서열 분석법인 NGS (Next-Generation Sequencing) 기술이 출현하면서, 유전자 연구에 접근하는 방식에 큰 변화가 있었다. 대량의 세포을 동시에 분석하면 희귀한 생물학적 현상을 확인하기 어렵다는 것이 명백하게 밝혀지면서, 연구자들은 single cell sequencing을 이용해 각각의 세포 역할을 확인할 수 있게 되었다.
Droplet에 기반한 single cell sequencing은 많은 수의 세포를 한번에 분석할 수 있지만, 세포를 완전히 이해하기에는 불충분하다는 것을 확인하였다.
최근, California Institute of Technology와 Allen Institute of Brain Science의 연구에서
SMART-Seq®을 이용한 전장 분석과 droplet 기반한 방법, 그리고 형태 분석을 통해 상호 보완적으로 single cell을 이해할 수 있음을 확인하였다 (Booeshaghi
et al. 2020).
Teaming up
연구자들은 BRAIN Initiative Cell Census Network의 mouse primary motor cortex (MOp) 분석 결과를 이용하였으며, 해당 결과는
SMART-Seq®로 분석한 6,160 세포와 10x Genomics Chromium (10xv3)로 분석한 90,031 세포로부터 도출되었다 (그림 1, Panel A). 두 기술을 이용한 경우 모두에서 다양한 세포 유형을 식별할 수 있었다. 10xv3를 이용했을 때에는 분석 가능한 세포의 수가 더 많기에 희귀한 세포 유형을 확인할 수 있었던 반면,
SMART-Seq을 이용했을 때에는 더 높은 감도로 전장 전사체를 분석할 수 있기에 isoform의 정량뿐 아니라, 세포를 세분화하여 분류할 수 있었다.
이후, 연구자들은 Glutamatergic, GABAergic neuron의 isoform을
SMART-Seq® v4를 이용해 분석하였고, 두 종의 세포에서 안정적으로 발현되는 260개의 유전자와 312개의 isoform marker를 확인하였다. 그 중
H3f3b는 하나의 isoform에서는 glutamatergic neurons에서 높은 발현을 보였고, , GABAergic neuron은
H3f3b-204 isoform의 낮은 발현을 보였다 (그림 1, Panel B). 해당 논문의 저자는 “유전자 수준의 분석으로는 isoform 변화에 대해 알 수 없다.”고 지적했다.
SMART-seq®을 이용한 isoform 정량, cell subclass, cluster assignments은 10xv3의 결과와 비교하여 검증되었으며, 이 데이터를 종합하면 isoform atlas을 포함하는 MOp으로 활용될 수 있다 (그림 2).
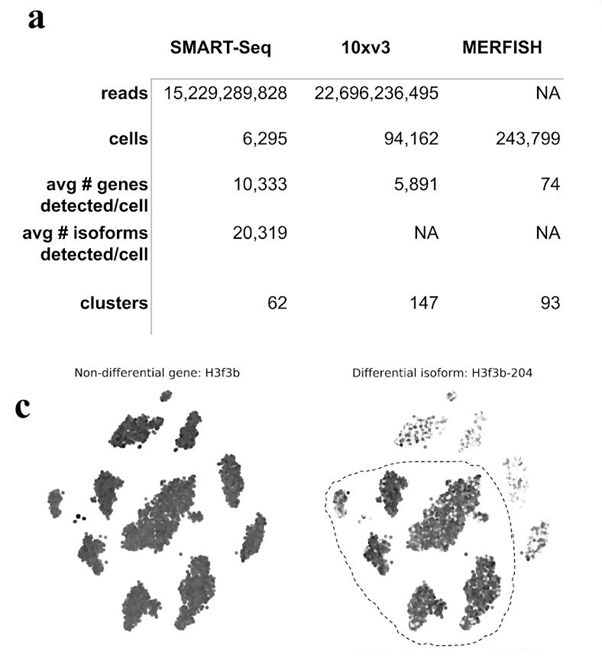 그림 1. 유전자 특이성 분석에서는 확인되지 않는 isoform 특이성
(Panel A)
그림 1. 유전자 특이성 분석에서는 확인되지 않는 isoform 특이성
(Panel A) Overview of data analyzed.
(Panel C) The
H3f3b gene abundance distribution across cells (left) and
H3f3b-204 isoform distribution across cells (right). Image and caption adapted from Figure 1 of
Booeshaghi et al. 2020 (some panels not shown) and used under a
Creative Commons Attribution 4.0 International License.
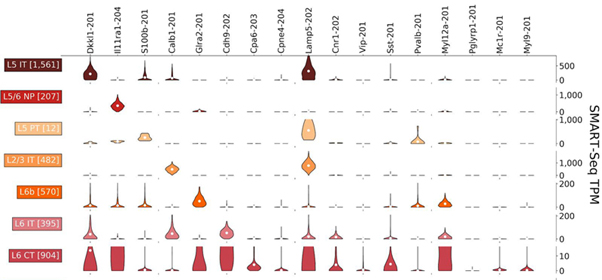 그림 2. Isoform atlas
A sample from an isoform atlas displaying isoform markers differential with respect to subclasses. Each row corresponds to one subclass, and each column corresponds to one isoform. SMART-Seq isoform abundance estimates are in TPM units, and each column is scaled so that the maximum TPM is four times the mean of the isoform specific for that row's cluster. Image and caption adapted from Figure 2 of
Booeshaghi et al. 2020 (subset of figure not shown) and used under a
Creative Commons Attribution 4.0 International License.
Isoform 발현을 보다 심층적으로 이해하기 위해, spatial MERFISH 분석 결과를 이용하여 SMART-Seq isoform 정량 값을 보정하고자 했다. 해당 논문의 저자는 MERFISH 분석을 통해,
Pvalb 유전자가 motor cortex의 전 조직에서 발현되고 있음을 확인하였으나,
SMART-seq®을 통해 확인된 두 isoform 중 하나만 발견할 수 있었다. 이를 통해, 만약 MERFISH만으로 유전자를 분석하는 경우 발현되는 isoform을 발견하지 못할 수 있음을 확인하였다.
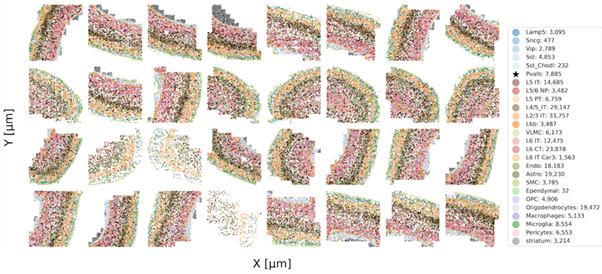 그림 3. Mop에서의 Pvalb 세포 (별표)의 분포 확인
Image and caption adapted from Extended Data Figure 7, Panel B of
Booeshaghi et al. 2020 (some data not shown) and used under a
Creative Commons Attribution 4.0 International License.
A new age for scRNA-seq analysis
아리스토텔레스는 “The whole is greater than the sum of its parts”라고 말했습니다. 이 연구는 하나의 기술을 이용하는 것 보다 서로 다른 기술을 접목하여 연구를 진행함으로써 심층적인 연구를 진행할 수 있음을 보여주는 예로, 해당 논문의 저자는 scRNA-seq에 대해 아래와 같은 관점을 제공합니다.
The [SMART-Seq] technology should be viewed as a complement, rather than competitor, to droplet or spatial single-cell RNA-seq. Our analyses suggest that a workflow consisting of droplet-based single-cell RNA-seq to identify cell types, then SMART-Seq [v4 chemistry] for isoform analysis, and finally spatial RNA-seq with a panel based on isoform-specific markers identified by SMART-Seq [v4 chemistry], would effectively leverage different technologies' strengths."
[원문] Combining droplet and full-length sequencing technologies for a complete picture
[참고문헌]
- Booeshaghi, A. S.
et al. Isoform cell type specificity in the mouse primary motor cortex.
bioRxiv 2020.03.05.977991 (2020).